🚨Key Highlights
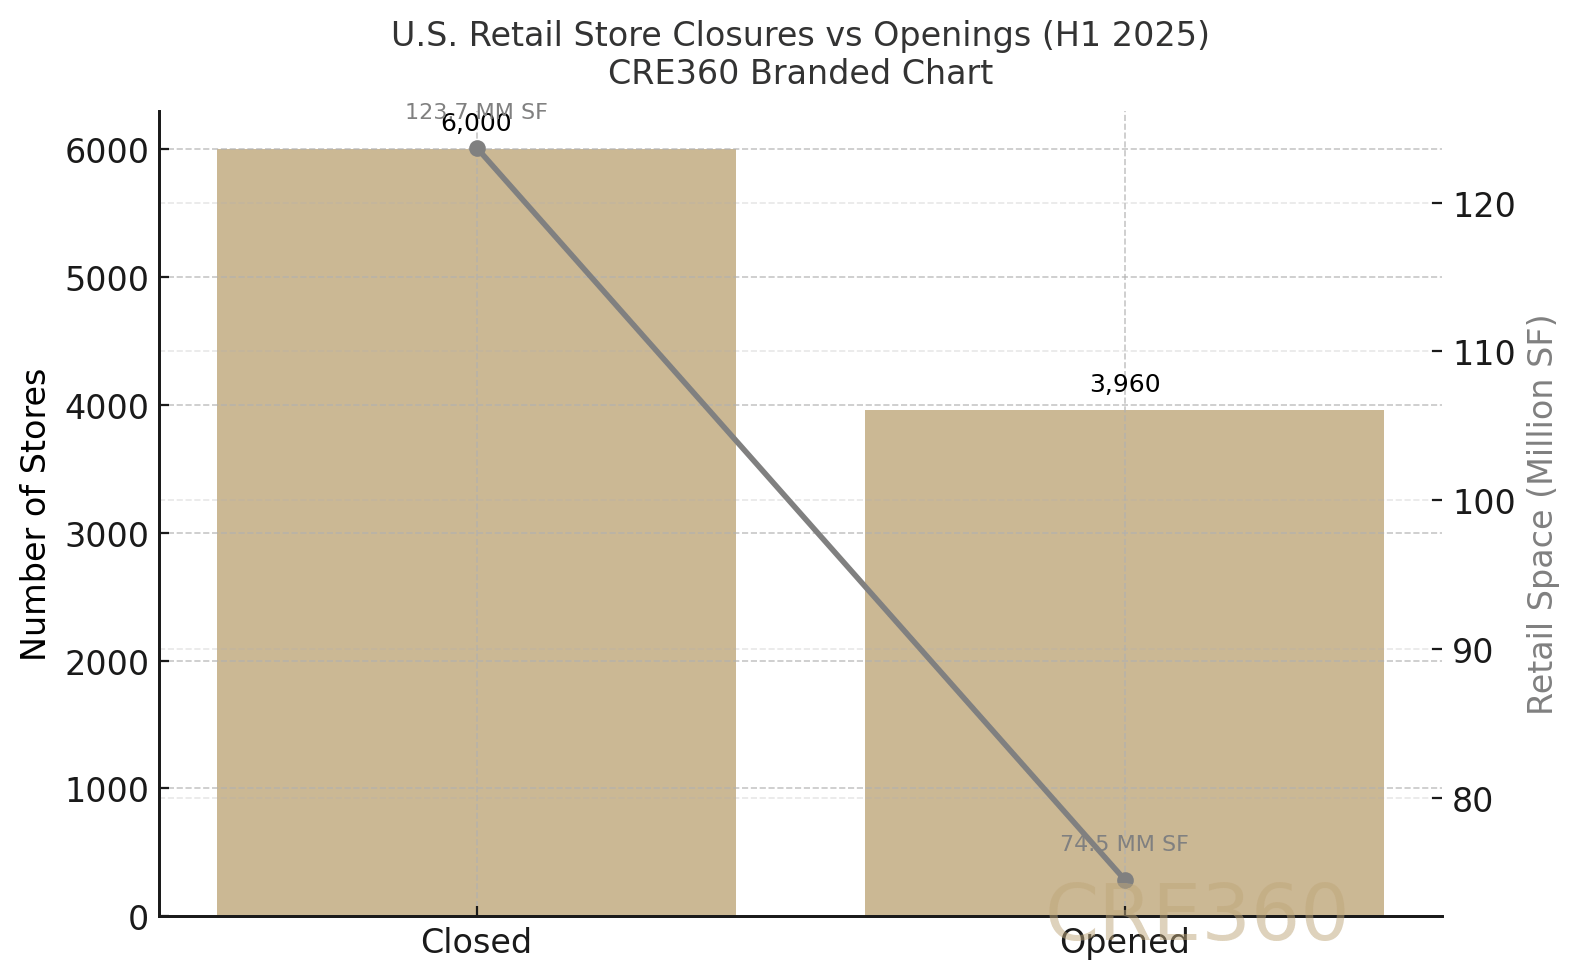
6,000 closures H1 2025 (123.7 MM SF lost) vs 3,960 openings (74.5 MM SF) — net retail shrinkage (–49 MM SF).
Off-price chains = 30% of new openings; fitness and health tenants backfill vacant boxes.
National vacancy ≈ 5.8% (Q2) — tightest since before COVID despite closures.
Rents +1% YoY overall; top metros (Miami, Phoenix) > +3%.
50+ retail sites in conversion pipelines, as adaptive reuse redefines valuation.
Signal
A historic shakeout is remaking American retail into a smaller but more resilient asset class. Roughly 6,000 store closures in H1 2025 erased 123.7 million square feet of space — nearly twice the new footage opened. Yet, national vacancy still hovered below 6%, and rents inched up 1% year-over-year. This is retail Darwinism in real time: weak concepts are disappearing while service-oriented and discount retailers expand, forcing capital to reprice survivors as long-term income assets rather than speculative plays.
Chapter 1 — Shrink to Strength
After a decade of demolitions and redevelopment, the U.S. retail inventory is leaner than at any point this century. Coresight projects a net loss of 9,200 stores in 2025, yet vacancy stays stable around 5.5–6.0%. Underbuilding since 2015 and steady absorption of prime pads by discounters (Dollar General, T.J. Maxx) explain the resilience. Every closure removes obsolete space — not market capacity. As a result, retail square footage per capita is down ~10% since 2018, but revenue per SF has improved. A smaller sector has become a healthier one.
Chapter 2 — Service is the New Anchor
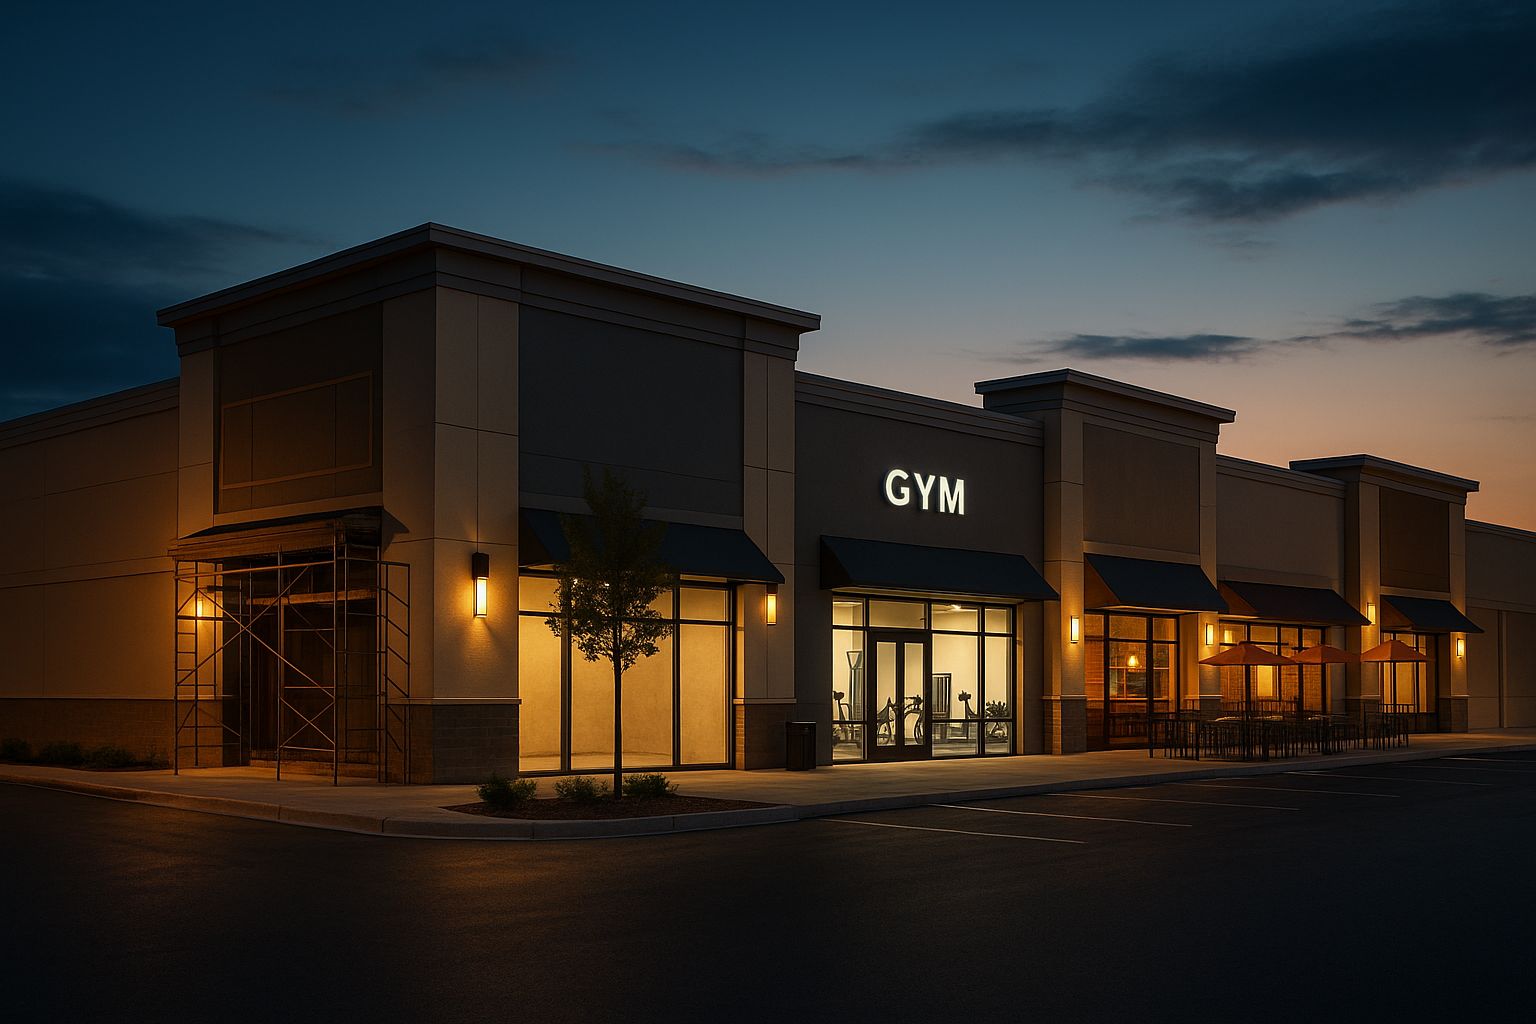
Gyms, clinics, fast-casual restaurants, and educational uses are replacing soft goods retailers in once-vacant boxes. Roughly 30% of new openings in 2025 are service tenants, a pivot that adds traffic durability. As one leasing broker in Dallas put it, “a doctor’s office doesn’t need Black Friday to pay rent.” The shift is reshaping lease structures — percentage rents are rarer, but tenant improvement allowances have risen to $40–60/SF for conversions. In turn, centers with essential-service mixes command yield premiums of 25–50 bps versus apparel-heavy peers.
Chapter 3 — Capital Returns to Retail
Investors have re-entered the segment with cautious confidence. Grocery-anchored centers trade at 6.0–6.5% cap rates, and competition is building for dominant open-air centers. Retail delinquencies in CMBS have fallen to 6.76% (Sept 2025) — below multifamily levels and far from office stress. Local banks and CMBS lenders are offering 60–65% LTV financing for stabilized assets. On balance, capital views retail as yield with containable risk — a notable reversal from the post-2017 malaise when “retail apocalypse” was the headline du jour.
Chapter 4 — Adaptive Reuse as Alpha
Over 50 former retail sites are actively converting to other uses — warehouses, clinics, and education facilities. Developers demolished more retail SF than they added in the past decade, producing an inventory that actually shrinks annually. For capital allocators, these “covered land plays” offer option value: today’s vacant anchor can become tomorrow’s multifamily or logistics node. Municipal zoning flexibility has improved, especially in suburbs seeking tax base diversification. Ultimately, reuse has turned a sector liability into a development pipeline.
Chapter 5 — Operator Edge
Operators who treat centers as community venues are outperforming. Programming events, hosting food-truck nights, and welcoming pop-ups fill gaps and boost tenant sales. Successful property managers now act as curators and marketers, not just landlords. Average occupancy in well-anchored centers sits around 95%, and downtime for anchor re-leasing averages 6–12 months. In practice, that means cash-flow variability is manageable — provided ownership budgets for higher TI and shorter leases to keep mix fresh.


The next phase is stability, not surge. Forecasts suggest RevPAR +3–5% by 2026 as global travel normalizes and inbound tourism returns. Luxury will continue to outperform, while select-service assets undergo consolidation or conversion. Supply growth remains below trend (<1%), cushioning occupancy through 2025. Should rates ease, cap rates could compress ~50 bps, rekindling portfolio M&A. Yet macro risks persist: slower GDP and fragile household spending may extend the plateau another year. Ultimately, hotels positioned for agility—cost control below, experience premium above—will define the cycle’s winners.
Hospitality’s new rule: experience earns pricing power, efficiency preserves it.

Coresight Research via eMarketer (Sept 2025) — U.S. Retail Closures and Openings Tracker — [emarketer.com] CoStar & Old Republic Title (2025) — Retail Vacancy and Supply Metrics — [kjk.com]CRE Daily and GlobeSt Reports (2025) — Adaptive Reuse and Capital Flows in Retail — [credaily.com] St. Louis Fed / MBA (2025) — CMBS Delinquency Summary by Property Type — [multifamilydive.com]


