🚨Key Highlights
Downtown retail vacancy down 90 bps to <4% in H1’25.
NYC metro multifamily rents +3.7% YoY (Q3’25).
Hotel occupancy led U.S. in summer (~85%); visitors 62.2M (2023) → ~66M (2025 proj.).
2025 multifamily sales pace approaching ~$10B (projection).
Historic foreign share of U.S. CBD office flows to NYC: 51% (2015–24); participation softened in 2024–25.
Underwriting: exit caps +50–100 bps; lower LTV, higher DSCR.
Signal
Event lead. By mid-2025, New York’s real-world indicators finally flipped green: office attendance and foot traffic overtook 2019 levels, dragging Downtown retail vacancy below 4% and lifting F&B sales corridors. That behavioral turn is feeding through to pricing logic—yet capital remains exacting. Lenders and equity alike are underwriting thicker risk premia, higher exit yields, and fuller expense ramps before funding growth. The city is recovering. It is not forgiving.
Retail: Worker-led demand outpaces tourism corridors
Downtown (~3.7%) and Midtown South (~5.0%) are tightening first as the return-to-office restores weekday spend and evening traffic. Meanwhile, tourist-dependent Uptown corridors linger near ~7% vacancy as international inflows normalize. In turn, high-frequency sales are supporting modest rent uplift on prime frontages and shorter downtime between tenants. The implication: 2025–26 leasing plans can lean into F&B, convenience, and services where workers drive daytime traffic; tourist-skewed luxury corridors still require patient concessions and TI packages. One sentence: pricing power is selective.
Multifamily: Steady top-line, defensive structure
NYC metro rents advanced +3.7% YoY in Q3’25 as stabilized vacancy hovered near ~2%. Meanwhile, expense inflation (labor, insurance, taxes) is rewriting pro formas: models assume thicker opex growth and +50–100 bps exit cap expansion versus the ultra-low-rate era. Insight: the bid for durable NOI is firm, but structure matters more than story. Implication: leverage is lower and DSCR thresholds higher; sponsors pencil 3%+ rent growth on market-rate units, 1–2% on regulated stock, and carry contingency for utilities and R&M. It’s cautious optimism—cash-flow first.
Hospitality & Tourism: Shoulder-season test after a strong summer
Hotels led major U.S. markets this summer with ~85% occupancy, supported by events and the rebound in international arrivals. Visitors totaled 62.2M in 2023 and are on pace for ~66M in 2025, closing the pandemic gap. By contrast, cost lines (union labor, taxes) keep margins tight even at high occupancy. Owners are reopening F&B and refreshing rooms, but capex is sequenced to rate visibility. Implication: if occupancy holds >80% into shoulder months, street-level retail tied to hotels should see sustained absorption and firmer rents.
Capital Flows: Re-entry, not a rush
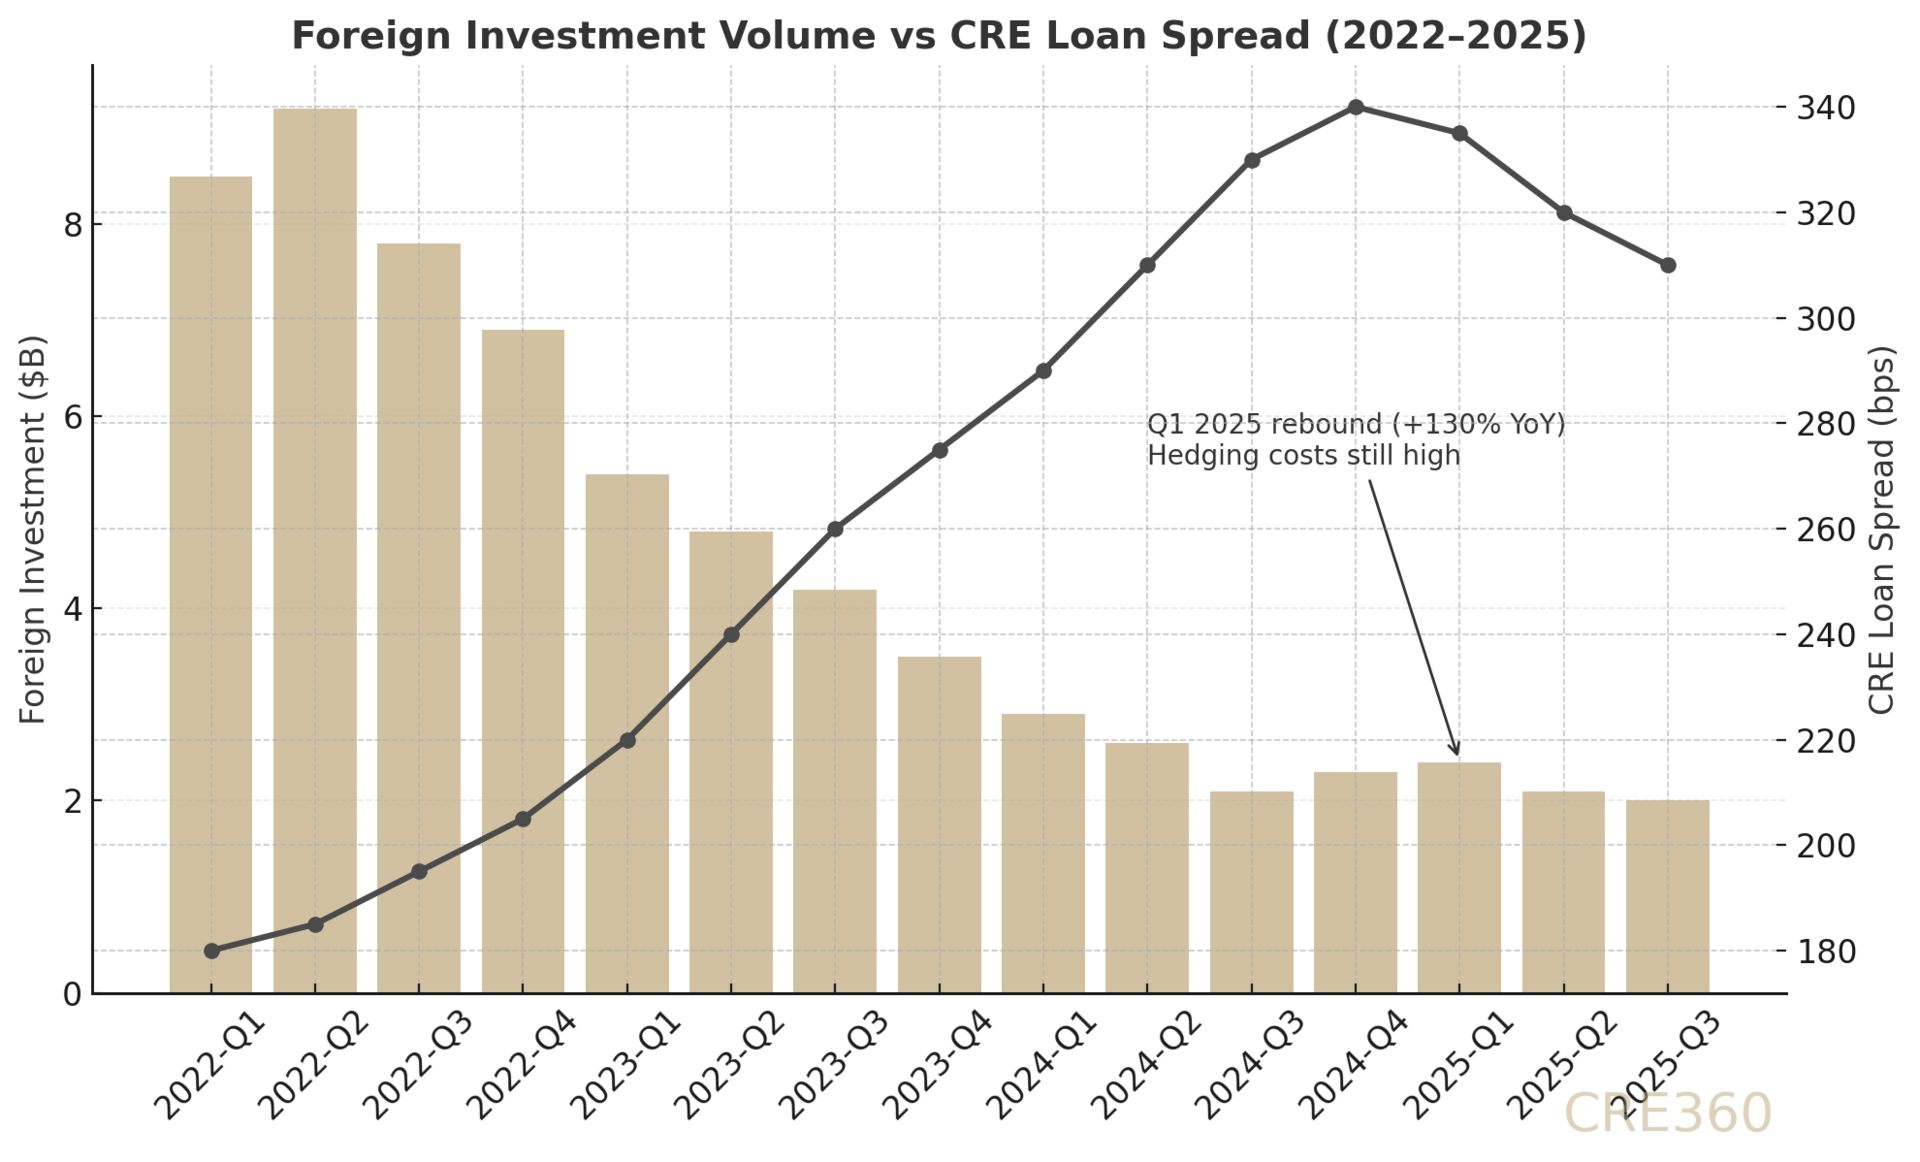
Transactionally, multifamily and prime retail lead the thaw; 2025 sales are pacing toward ~$10B as pricing stabilizes ~15–30% below peak. Nonetheless, many investors stayed “on pause” through 2Q’25, and cross-border allocations softened despite NYC’s historic magnetism (51% of U.S. CBD office foreign investment 2015–24). Insight: capital is rewarding clean rent rolls, light capex, and transparent opex—beta is out, durability is in. Implication: expect a two-track market—core and core-plus trade; heavy-lift offices remain equity-intensive with mezz or rescue capital setting terms.
Underwriting Guardrails: Lean forward on revenue; tighten the spine
Revenue: modest rent regrowth assumptions (market-rate ≥3%), improved retail line-of-sight where foot traffic is proven. Costs: fatter opex ramps and tax growth. Structure: lower LTV, higher DSCR, robust interest-rate caps. On balance, exit caps are marked +50–100 bps over last cycle, and business plans prioritize rollover visibility and capex clarity. The practical test: who can show resilient NOIs under less rosy assumptions?


Through 1H’26, CRE360 expects New York’s fundamentals to keep firming as worker-led demand compounds and tourism nears full recovery. If policy and rates stabilize, deal volume should grind higher from 2025’s base—led by multifamily, mixed-use, and prime street retail. For now, the risks cluster around expense drift (insurance/taxes), office obsolescence, and timing mismatches between capex and leasing. Watch three tells: (1) hotel occupancy staying >80% into shoulder season; (2) Midtown South rollover clearing at stable rents; (3) incremental re-engagement from cross-border buyers as FX and hedging costs ease. Execution—not optimism—unlocks pricing.
Capital structure is policy in physical form.

Marcus & Millichap — NYC Retail, Mid-2025 Cushman & Wakefield — U.S. Multifamily MarketBeat Q3 2025 CoStar/STR — NYC Hotel Performance, Summer 2025 Office of the NYS Comptroller — Tourism in NYC (2023–2025) JLL / CRE Daily — NYC Multifamily Sales Pacing 2025 Invesco — Cross-Border Investment in U.S. CBD Offices (2015–2024) JBREC — CRE Investor Survey 2Q 2025


