🚨Key Highlights
Single-asset transactions over $100 M in CRE rose to ~$180 B in the past 12 months (+24% YoY).
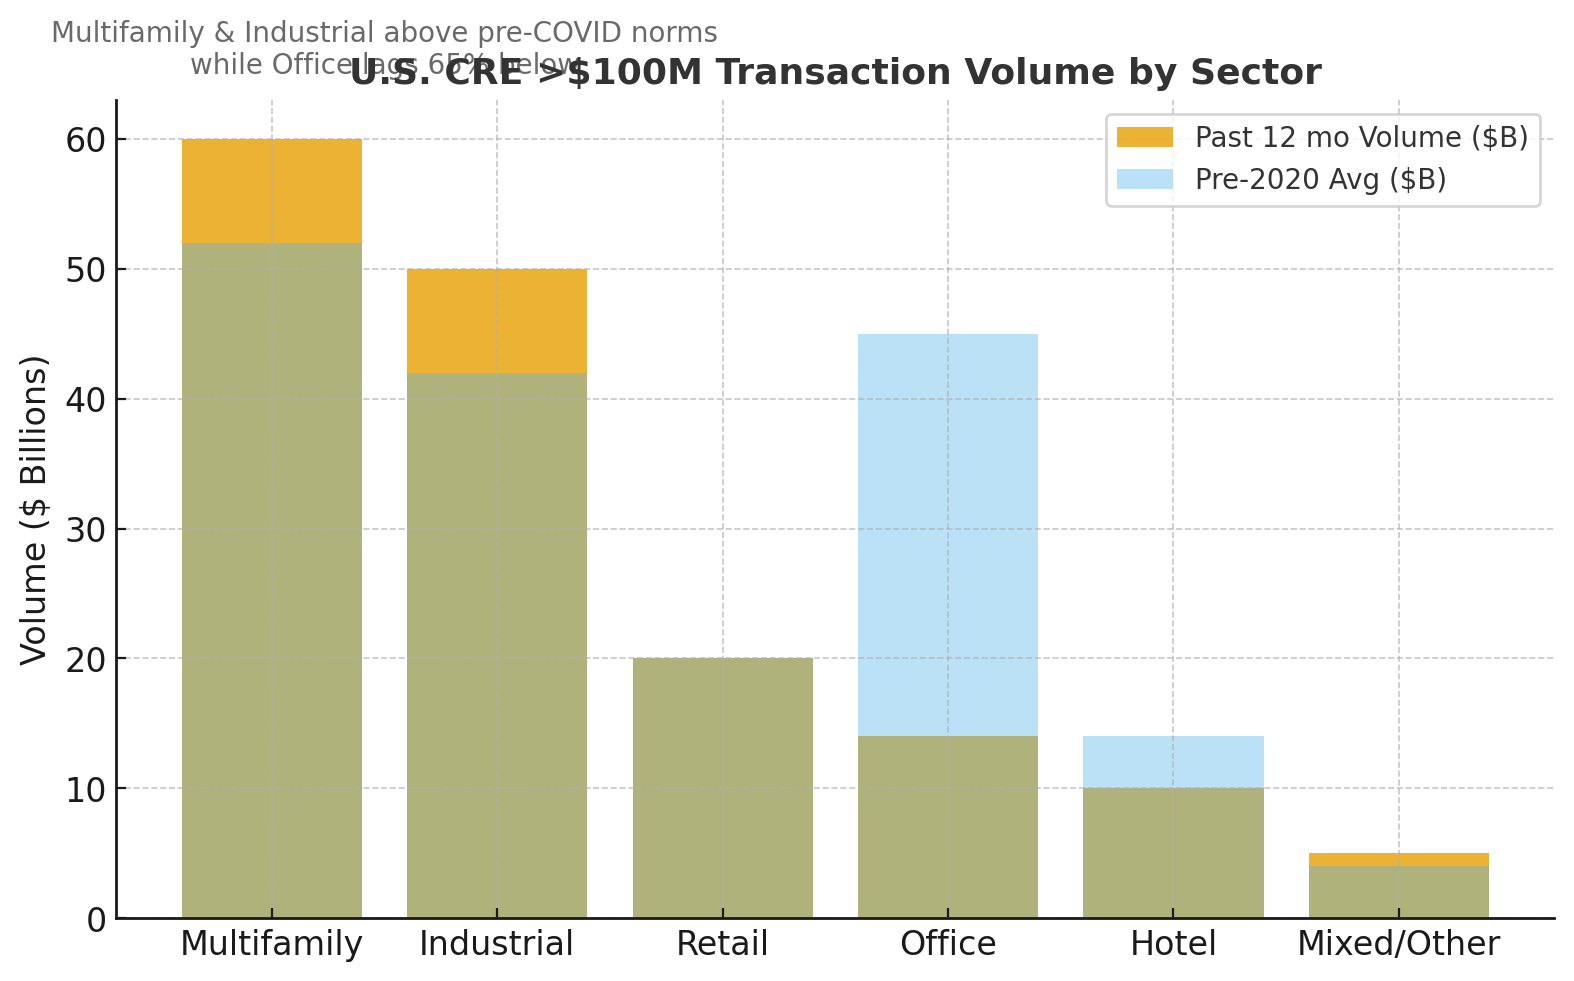
Office sales >$100 M totaled just $14 B (-65% vs. pre-2020 average $40–50 B).
Multifamily and industrial command ≈65% of institutional allocation (2025 proj.).
Portfolio sales volumes still ~20% below 2019 as mixed-quality bundles stagnate.
Cap rates for prime apartments and logistics compressed ≈25 bps despite high rates.
Signal
Institutional capital is fragmenting its bets. After two years of market paralysis, large investors have returned—but with precision. In 2025, deals above $100 million have surged in multifamily and logistics assets, while office and mixed portfolios remain frozen. Rather than buy fifty-building bundles, pension and sovereign funds are picking off individual trophy assets—one tower, one warehouse at a time. The result is a record count of large single-asset trades in favored sectors and a shrinking office share of institutional portfolios.
Precision Capital
The shift is quantifiable. Multifamily accounted for ≈ $60 billion in >$100 M transactions over the past year—15% above its 2015–2019 average. Industrial logged ~$50 billion, up 20% from pre-COVID norms. Office barely cleared $14 billion. “Investors want certainty of income, not scale for scale’s sake,” notes a New York CMBS structurer. Because lenders can underwrite a single asset’s cash flow and tenant risk more easily than a portfolio’s variance, financing is flowing disproportionately to stand-alone deals. As a result, single-asset loan issuance has grown while CMBS conduit (voluminous portfolio debt) is off by roughly 30% year to date. On balance, clarity is trumping complexity.
Office Exclusion
.By contrast, office remains the absentee at the auction. Annual large-office sales have collapsed from $45 billion pre-2020 to $14 billion in the past twelve months. Institutions will still buy a “one-off trophy”—as seen in the $1.1 billion Deutsche Bank Center refi and SL Green’s $730 million Park Avenue Tower acquisition—but they won’t touch bundled office risk. Meanwhile, cap rates for prime office have expanded ~100 bps since 2023, reflecting a liquidity penalty. Still, few sellers will mark down assets to the levels buyers demand, leaving a valuation gap that only distress.
Re-Engineering Portfolios
Sellers are adapting. Mixed-asset packages are being split, with strong components sold individually and weaker ones either held or transferred through note sales. This has lifted the median price per square foot for core industrial and apartment assets even as aggregate volumes lag 2019 by ~20%. In practice, the market is rewarding “micro clarity.” Each deal reveals a specific rent roll, lease term, and market story—conditions valued by allocators who must justify every basis point of risk. For now, granular trading is the mechanism through which price discovery returns.
Behavioral Shift
The operational impact is tangible. Fund managers report needing three times as many individual acquisitions to deploy the same capital as a single portfolio once did. Competition for prime one-offs is intense—Dallas multifamily high-rises and Inland Empire logistics centers regularly draw ten institutional bidders. Cap rates for top-tier Sun Belt apartments compressed ≈25 bps this year despite static Treasury yields. The behavior echoes post-GFC discipline: underwrite each property’s micro-market before trusting macro themes. Still, some allocators worry about execution drag—more transactions, more due diligence, less scale.
Sector Rotation
Institutional allocations are being rewired. Since 2019, office’s share of core real estate portfolios has fallen from 35% to ~15%, while multifamily and industrial together now command ≈65%. Retail is steady at 10%, but its composition has shifted toward grocery-anchored centers. Data centers and life-science labs fill the “other” bucket previously dominated by hotels. These allocations mirror liquidity: capital flows where buyers can exit. In turn, debt markets price that liquidity—lower spreads for multifamily and logistics loans, higher for office. The re-pricing of risk has become the new market discipline.

Over the next 12–24 months, expect the “granular capital” trend to persist until interest rates ease or distress forces portfolio sales. Future “rebundling” could occur once valuations stabilize—aggregators may assemble consistent assets to offer core funds scale again. For now, institutional underwriting will remain asset-by-asset. Prime sectors may see cap rates compress another 25–50 bps if 10-year Treasuries fall below 4%. Office values likely drift lower until vacancy stabilizes or conversion capital absorbs supply. Brokerage and legal firms should plan for high deal counts but smaller ticket sizes through 2026.
Granularity is the new scale—capital’s discipline is now measured one asset at a time.

CRE Daily — Big Investors Pivot: Single-Asset Deals Surge (Oct 2025) — credaily.com CBRE Research — U.S. Capital Markets Review Q3 2025 MSCI Real Assets — Transaction Data Set 2025 (Prelim.) Fitch Ratings — CMBS Quarterly Update Sept 2025


